

A bad experience can cost a brand a customer: 52% of U.S. consumers said they had stopped using or buying from a brand because of a bad product or service experience, according to PwC's 2025 Customer Experience Survey, which covered 5,511 consumers and 406 executives. Measuring satisfaction matters, but collecting a score is only the beginning. The useful question is whether that score reflects the experience customers had, including those who never respond.
Table of Contents
- Why One Satisfaction Score Misleads
- CSAT NPS and CES Side by Side
- How to Field a Post Resolution Survey
- Judge Whether a Score Change Is Real
- Satisfaction for AI and Human Support
- Collect the Rating and Review One Segment
Why One Satisfaction Score Misleads
Satisfaction is how closely a recent experience matched what a customer expected and needed. A rating after a support chat can show whether the customer liked the interaction. It says less about whether the answer was correct, how much effort the resolution took, or whether the customer would buy again.
A single score also hides who answered. When only the happiest or angriest customers respond, the average describes a fraction of the people the team served.
And when AI resolves some conversations while a person handles others, one number blends two different experiences into a result that describes neither.
The gap between measuring and learning is a practical problem. In Deloitte's 2025 CX Study, 96% of surveyed large German companies measured customer satisfaction, while only 20% turned the data into quantifiable financial benefits. A score earns its place when it helps a team decide what to fix.
A satisfaction score works like a thermometer: it shows that something is wrong without identifying the cause. A low rating might follow a wrong answer, a long wait, a confusing process, or a handoff that forced the customer to repeat the problem. Each cause calls for a different response, and a single average cannot tell them apart.
The diagnosis gets clearer when each metric answers its own question. CSAT covers satisfaction with a specific interaction, CES covers how easy it was to get help, and NPS or renewal intent covers the wider relationship. The team can then compare those perceptions with repeat contacts, complaints, and churn instead of collapsing every signal into one headline number.
The same logic appears in Planstone's guide to how to interpret event evaluation results: feedback becomes useful when it identifies a specific part of an experience that can be improved. For a support team, that means reading each score against the question it asked, the customers who stayed silent, and whether a human or the AI handled the case.
CSAT NPS and CES Side by Side
| Metric | Question | Scale | How to calculate | Best moment |
|---|---|---|---|---|
| CSAT | How satisfied are you with this interaction? | 1–5 or 1–7 | Top-box responses ÷ all responses × 100; also report the mean | Right after a resolved chat or email |
| NPS | How likely are you to recommend us to a friend or colleague? | 0–10 | Percent scoring 9–10 minus percent scoring 0–6 | Quarterly or after onboarding, not every ticket |
| CES | The company made it easy for me to handle my issue | 1–7 agreement | Average score, plus the share who agree (5–7) | After a completed task such as a return or order change |
CSAT measures a specific interaction
CSAT asks customers to rate their satisfaction with a recent experience. On a five-point scale, the team can calculate the top-box percentage by counting responses of 4 or 5, dividing by all responses, and multiplying by 100. On a seven-point scale, the top box is 6 or 7.
For example, if 40 out of 50 responses are in the top box, the result is 80%. The mean score should be reported too. Two support teams could have the same top-box percentage while one receives mostly high ratings and the other has many neutral scores just below the cutoff.
CSAT fits a resolved support interaction because the customer can rate a specific moment. It doesn't, by itself, explain whether the customer found the process easy or whether the experience changed their overall loyalty.
NPS measures the relationship, not the last reply
NPS uses a 0–10 recommendation question. Responses from 9 to 10 are promoters, 7 to 8 are passives, and 0 to 6 are detractors. The calculation subtracts the percentage of detractors from the percentage of promoters, producing a score from −100 to +100.
That score reflects a relationship-level view, not a verdict on one support conversation. A customer might be satisfied with an agent's reply but still hesitate to recommend the business because of pricing, product limitations, or an earlier experience. For that reason, NPS fits a relationship cadence, such as after onboarding or periodically, rather than a survey after every ticket.
CES shows whether the path was easy
CES asks customers to rate an effort-related statement, commonly, “The company made it easy for me to handle my issue,” on a seven-point agreement scale. A team can report the average and the share agreeing, using scores from 5 to 7 for that share. A guide to understanding user effort scores can help teams distinguish effort from satisfaction when shaping the question.
The trade-off is easy to miss: high satisfaction with high effort means a customer may have accepted the answer but found the route to it painful. Conversely, an easy process doesn't guarantee the answer was correct or reassuring. CSAT, NPS, and CES aren't substitutes, and they can move in opposite directions. For support operations, CSAT plus CES gives a more useful view of the interaction. NPS belongs in the measurement plan when the decision concerns loyalty, not the quality of one reply.
How to Field a Post Resolution Survey
A post-resolution survey should arrive while the interaction is still easy to recall, but it should remain short enough to complete without becoming another support task. Use a repeatable process so responses can be compared across channels and service modes.
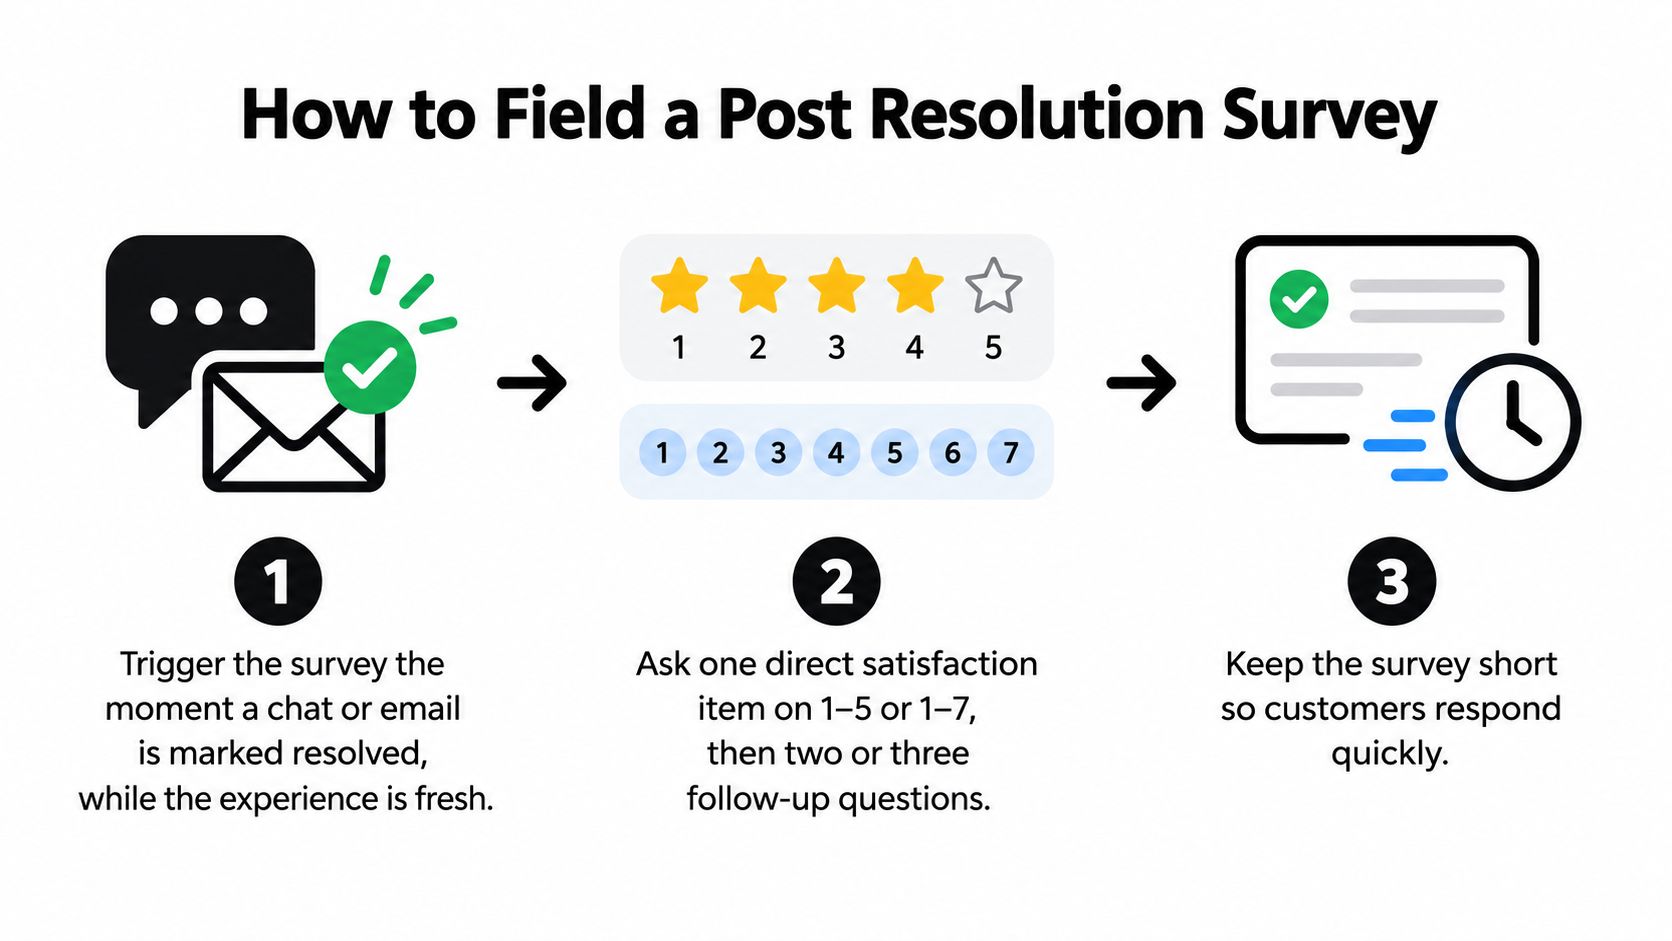
Trigger at resolution. Send the survey as soon as a chat or email is marked resolved. A fresh memory is more useful than a rating collected well after the customer has moved on.
Ask a direct rating and a few driver questions. Start with one CSAT item on a 1–5 or 1–7 scale. Add two or three short questions about whether the answer was correct, met expectations, and resolved the issue. The ACSI model uses three weighted satisfaction evaluations: overall satisfaction, whether the experience fell short of or exceeded expectations, and how closely it matched the customer's ideal. A small team doesn't need that econometric model, but it still needs more than one item to understand what a rating means.
Record the context. Store the channel, issue type, language, AI-versus-human handling, and whether the conversation was escalated. Without these fields, teams can't tell which kind of interaction sits behind an overall average.
Filter responses carefully. Exclude contacts that aren't recent, and flag replies that look inattentive, such as identical scores across every item with no meaningful comment. Screening can improve the usefulness of the results, but teams should use consistent rules rather than removing low ratings because they look unusual.
Set a sample floor before comparing weeks. A small set of replies can swing sharply when just a few customers choose different ratings. Teams should use a minimum sample threshold and confidence intervals where available; when a weekly sample is too small to interpret, combine periods instead of treating a noisy change as a trend.
Attach operational fields. Link first-response time, resolution time, transfer count, and reopen rate to the survey record. These measures give the team a way to test practical questions, such as whether slow responses coincide with lower satisfaction or whether repeated handoffs are followed by reopened issues.
Invite one open comment. A short optional field gives customers room to explain a rating in their own words. Read comments alongside the scores, not as a replacement for them, and look for repeated themes that point to a fix.
Teams that need help choosing the wording can use this guide to CSAT survey questions. The end product should be a record that can be filtered by channel, issue, language, and handling path, not a single company-wide average.
Judge Whether a Score Change Is Real
A score can rise even when the experience hasn't improved for most customers. The change becomes more credible when the response sample, customer segments, and behavioral signals point in the same direction.
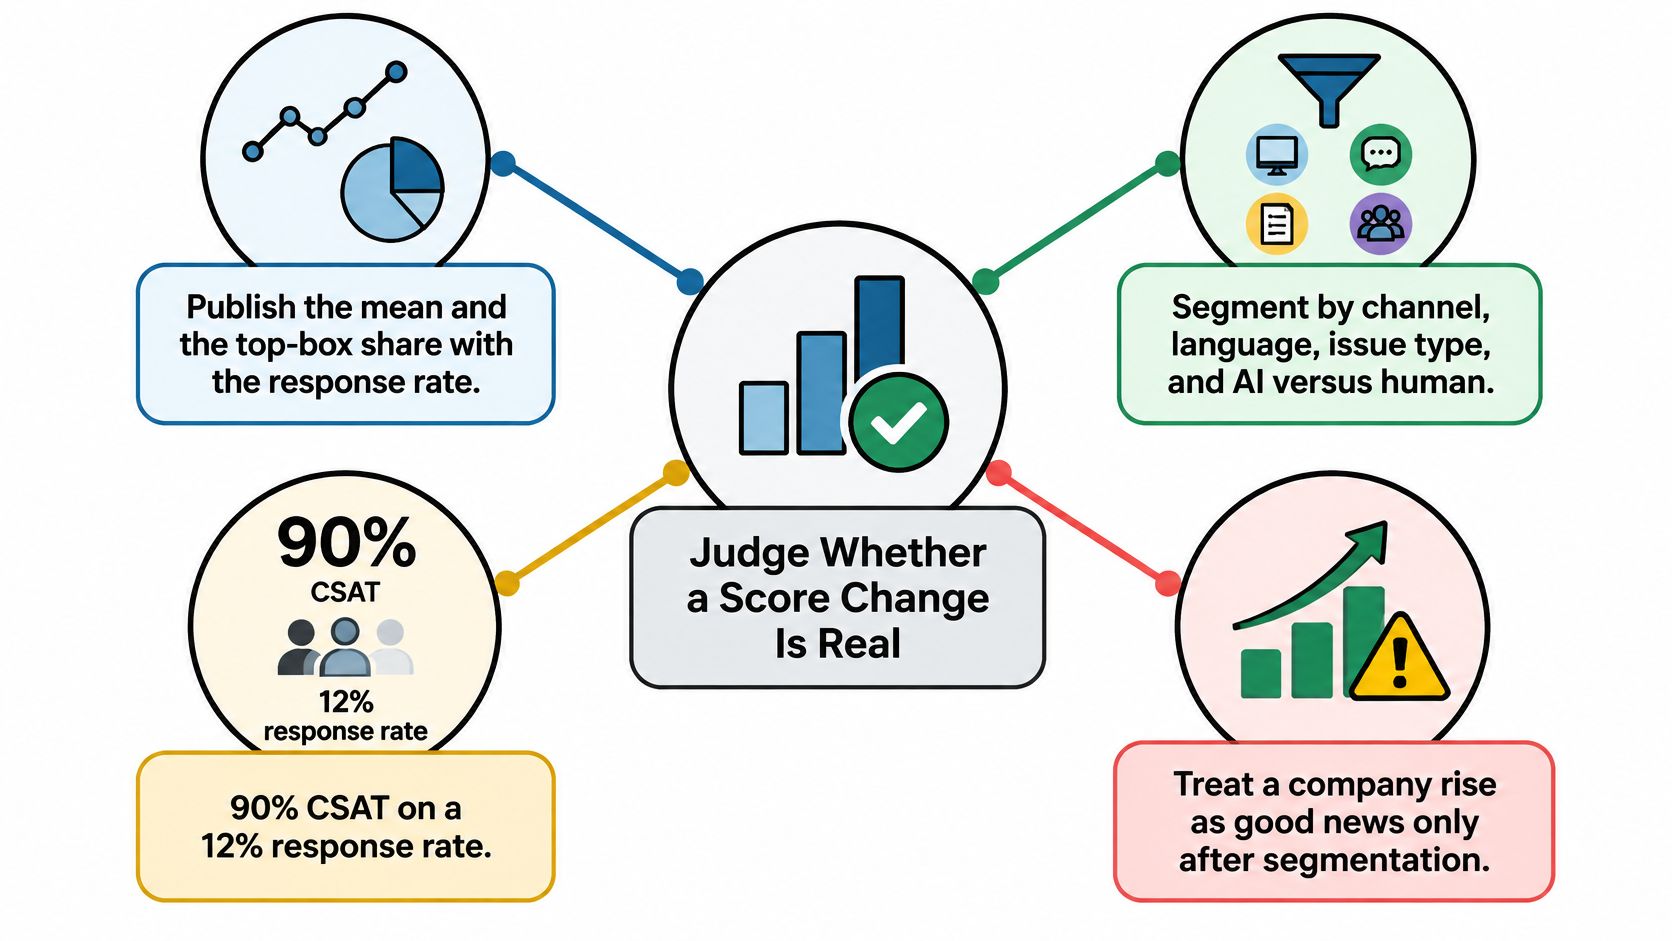
Put the score in context
Publish the mean and top-box share alongside the response rate. A hypothetical 90% CSAT on a 12% response rate describes the customers who chose to answer, not everyone who had an interaction. The silent group may include satisfied customers who didn't feel like replying, unhappy customers who abandoned the process, or people who continued to need help.
Show five pieces of context beside every score:
- Response rate: How many eligible customers replied?
- Channel: Did the experience happen over chat or email?
- Customer segment: Which customer group does the result represent?
- Interaction type: What issue or task did the customer bring?
- Time since resolution: How soon after the interaction did the survey arrive?
Segmenting matters because an overall score can improve while one group's experience gets worse. Compare channel, language, issue type, and whether AI or a person handled the case before treating a company-wide rise as good news.
Check what nonresponse hides
Customers don't always give an unbiased report of an experience. Politeness, expectations set by the brand, confirmation bias, ownership effects, and dissonance reduction can all influence reported satisfaction. A 2025 study of online reviews also found that both the likelihood of posting and the rating submitted varied by platform, creating nonresponse and measurement bias.
That means a flattering score may say as much about who replied as it does about the service. A slightly lower but more representative result can be more actionable than a high rating from a narrow group of willing respondents. For a practical way to examine patterns across customer conversations, see this guide to contact center analytics.
Compare feedback with behavior
Keep two dashboard rows. The first is solicited feedback, including CSAT, CES, and any relationship measure the team uses. The second is customer behavior, including repeat contacts, complaints, escalations, reopened tickets, cancellations, and time to resolution.
Check repeat contact and reopened issues within a consistent follow-up window, such as 7 or 30 days. Those windows help teams see whether the customer had to seek help again soon after the original conversation or later. The ACSI framework links expectations, perceived quality, and perceived value to satisfaction, then connects satisfaction to complaints and loyalty. For support teams, that distinction helps separate possible causes of a rating from outcomes that follow it.
One testable hypothesis might be that faster first responses lift satisfaction only when the answer is also correct. Another might be that additional transfers are associated with lower ratings. Compare cases with similar customers, channels, and issue types where possible, rather than attributing a raw average difference to a single operational change.
Broader experience measures can provide context, but they're not a substitute for a team's own analysis. Forrester reported that average U.S. customer experience effectiveness was 64% and ease was 66% in 2024, two experience-quality measures closely related to satisfaction, in its 2024 Customer Experience Index. In a separate 2024 U.S. customer satisfaction ranking, Forrester reported a one-percentage-point decline based on a survey of 98,363 consumers evaluating 223 brands across 13 industries.
A weekly difference inside a wide confidence interval doesn't justify a roadmap change by itself. Treat a change as real when the sample is sound, the same customer segments are represented, and behavioral outcomes support the interpretation.
Satisfaction for AI and Human Support
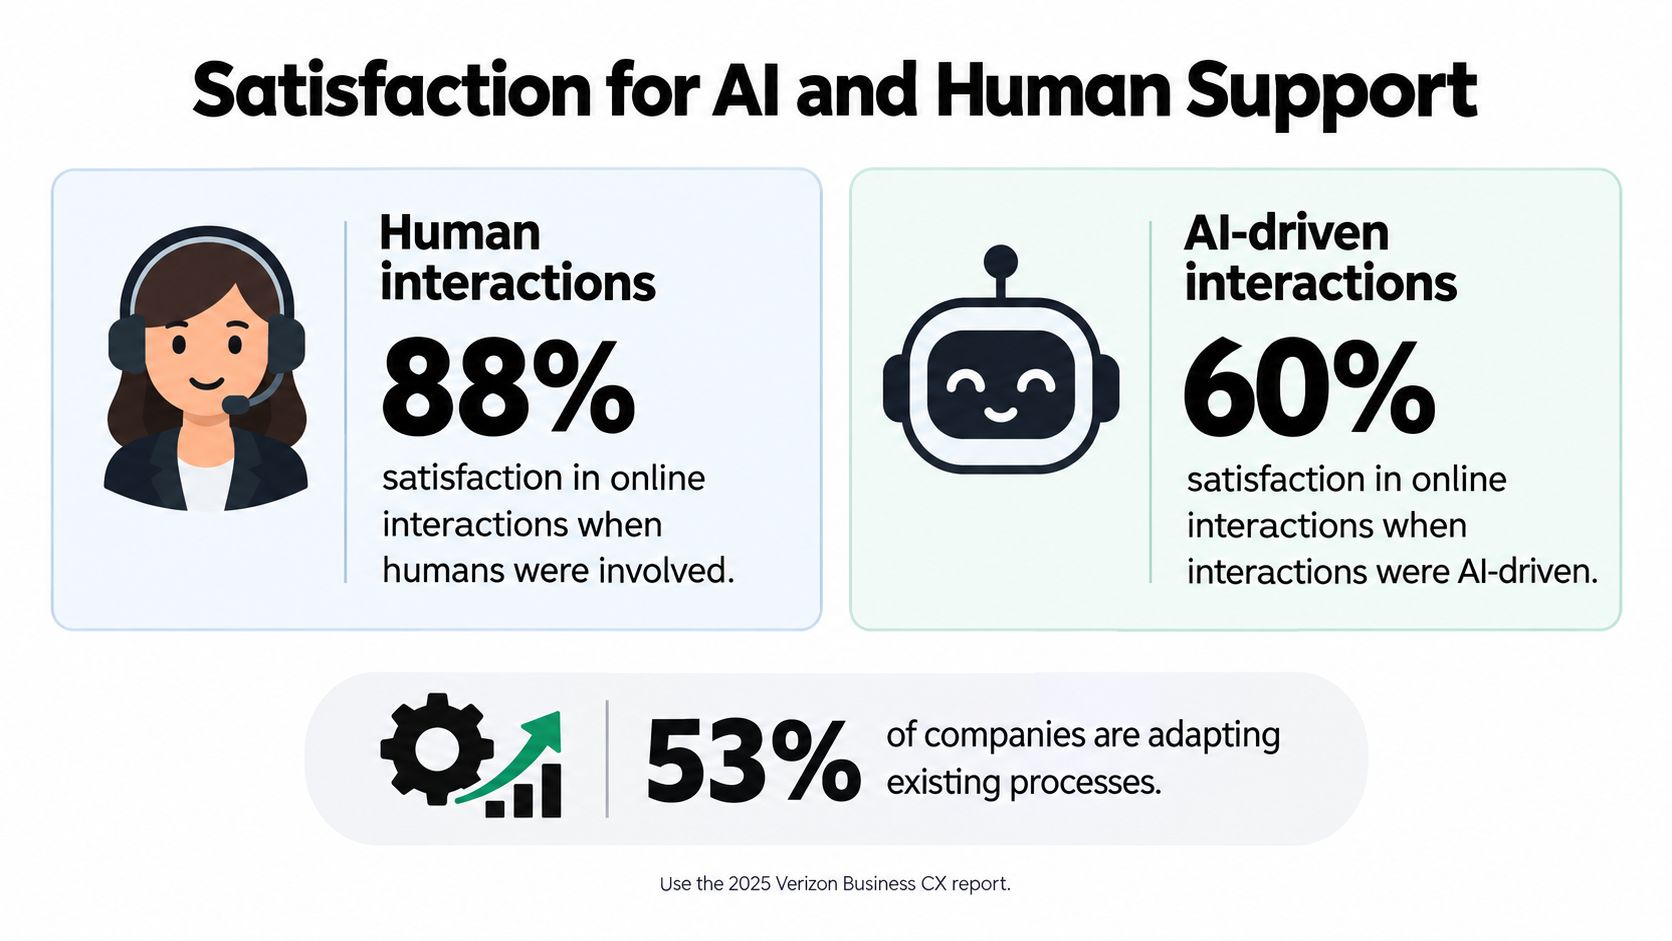
In online interactions, satisfaction was 88% when humans were involved and 60% when interactions were AI-driven, according to the 2025 Verizon Business CX report. The contrast shows why a blended CSAT number can hide important differences. The same report found that 53% of companies were adapting existing customer experience metrics for AI, while about one-third were developing entirely new ones.
AI can suit a short, competency-driven task, such as checking an order status against a reliable source. A human agent may be better placed to handle an exception, a distressed customer, or a conversation where trust and warmth matter. The useful question isn't just whether customers were satisfied. It's which service mode worked for which task, and at what effort.
| Service mode | Scores to keep | Extra fields | What one average hides |
|---|---|---|---|
| AI contained the case | Same CSAT and CES scales | Resolved or not, knowledge source used, language | Strong scores on simple questions |
| AI then human | CSAT after the human reply | Customer had to repeat context, summary used, effort | Friction created by the handoff |
| Human from the start | CSAT, CES, and a trust item | First response, transfers, reopen | Warmth on complex or emotional issues |
Keep handling paths separate
Use the same core rating scales for three paths: AI contained the case, AI handed it to a person, or a human handled it from the start. This makes the results easier to compare without confusing differences in question wording with differences in experience.
For an AI-to-human handoff, record the customer's satisfaction after the agent replies, whether the customer had to repeat the issue, the effort involved, and whether the case was resolved. Also retain language and channel. Those details reveal whether the customer received a smooth continuation or had to start again.
A useful diagnostic is handoff-adjusted satisfaction: compare the change in sentiment after a human receives an AI-generated summary with the result in cases where customers had to retell their story. A summary can preserve context, but the rating should still be read alongside the resolution outcome and customer effort.
Containment alone isn't success if the AI gave a wrong answer or left the issue unresolved. Put cost and service effort beside the scores, including number of turns, handling time, and escalation rate. The dashboard should make it possible to ask which service mode satisfied customers for which task, and how much effort that experience required.
Collect the Rating and Review One Segment
One segment, one change, one follow-up check. That is the whole routine. Starting from the company-wide average hides where the problem sits, so begin smaller and let the segment point to the cause.
Open the weakest segment from the previous week. Compare AI-only conversations, AI-to-human handoffs, and human-led cases rather than starting with the overall company score. A team can then see whether a low rating clusters around a particular task or handling path.
Choose one controllable cause. If customers repeat their problem after an escalation, improve the handoff. If AI answers rely on missing or unclear information, update the relevant help article or knowledge source. Changing one thing at a time makes it easier to tell whether the adjustment helped.
Recheck the same segment. Compare its rating with repeat contacts and reopened tickets within the chosen follow-up window. If those signals disagree, check that each conversation's handling path was recorded accurately and that escalations are logged consistently before setting a team target.
One caution before reading any segment average: a rating only describes the customers who answered. When few customers respond, the score leans toward those who felt strongly enough to bother, while the silent majority stays invisible. Teams that want to raise response rates can borrow review outreach tips from TheBestReputation. For support measurement, timing and consistency matter: a rating request should be linked to the interaction it evaluates, not sent as an unrelated request.
SignalZen collects a chat rating request when a conversation closes, and the business configures the rating screens. When an email conversation is closed, the recipient receives a rating email. A practical starting point: enable ratings on both channels, record each conversation's handling path (AI only, AI-to-human handoff, or human-led), and review comments alongside reopened tickets before trusting the overall average. More detail on why closing chats is beneficial and how chat ratings work can help teams connect the close of a conversation to the feedback process.
SignalZen brings AI support, live chat, email, and human handoffs into a shared workflow, with teams able to respond from Slack, Microsoft Teams, or Google Chat. For small and medium businesses that want to collect ratings when support conversations close and compare AI and human handling, visit SignalZen to see how its support platform fits the team's measurement process.



Better support without a bigger support team.
Start with AI. Add your team when the conversation needs a person.