

Most support teams track a dozen numbers and couldn't say what half of them are for. A dashboard holding CSAT, NPS, first response time, resolution time, ticket volume, and containment looks rigorous, yet a number with no decision attached is decoration. Worse, several of these metrics contradict each other when read in isolation.
The metrics split into four families. Experience metrics (CSAT, NPS, CES) record how the customer felt. Speed metrics (first response time, average resolution time, average handle time) record how fast the machine moved. Quality metrics (first contact resolution, SLA compliance) record whether the work held up. Automation metrics (AI containment, escalation rate) record what the AI handled and where it stopped.
Each family fails in a predictable way. Live on experience scores alone and nobody staffs for Monday morning. Live on speed and agents learn to close tickets rather than solve them. Live on containment and customers get trapped in loops that look efficient on a chart.
This list treats every metric the way a support lead briefs a new hire: what it counts, when it's the right dial to watch, where it lies, and what to change in the first hour of the week. Ten KPIs and metrics, in the order a team usually grows into them.
Table of Contents
- 1. Customer Satisfaction Score (CSAT)
- 2. Net Promoter Score (NPS)
- 3. Customer Effort Score (CES)
- 4. First Response Time (FRT)
- 5. Average Resolution Time (ART)
- 6. First Contact Resolution (FCR)
- 7. AI Containment Rate
- 8. AI-to-Human Escalation Rate
- 9. Average Handle Time (AHT)
- 10. SLA Compliance Rate
- 10 Customer Support KPIs and Metrics at a Glance
- Building a Balanced Scorecard and Deciding Which Metrics to Pair
1. Customer Satisfaction Score (CSAT)
CSAT measures satisfaction with one interaction. A single question goes out after the chat closes or the ticket resolves, usually on a 1 to 5 scale, and the score is the share of responses landing on 4 or 5. Report it that way rather than as an average, because a five-point mean hides how many people were actively unhappy.
When it's the right dial to watch
CSAT is the fastest confirmation that an answer landed, and the cheapest audit of AI replies, since a confident wrong answer shows up as a low score within hours. A SaaS team that tags CSAT by topic usually finds one topic dragging the average down, rewrites the article behind it, and watches the score recover over the following weeks.
The trade-offs are easier to see side by side.
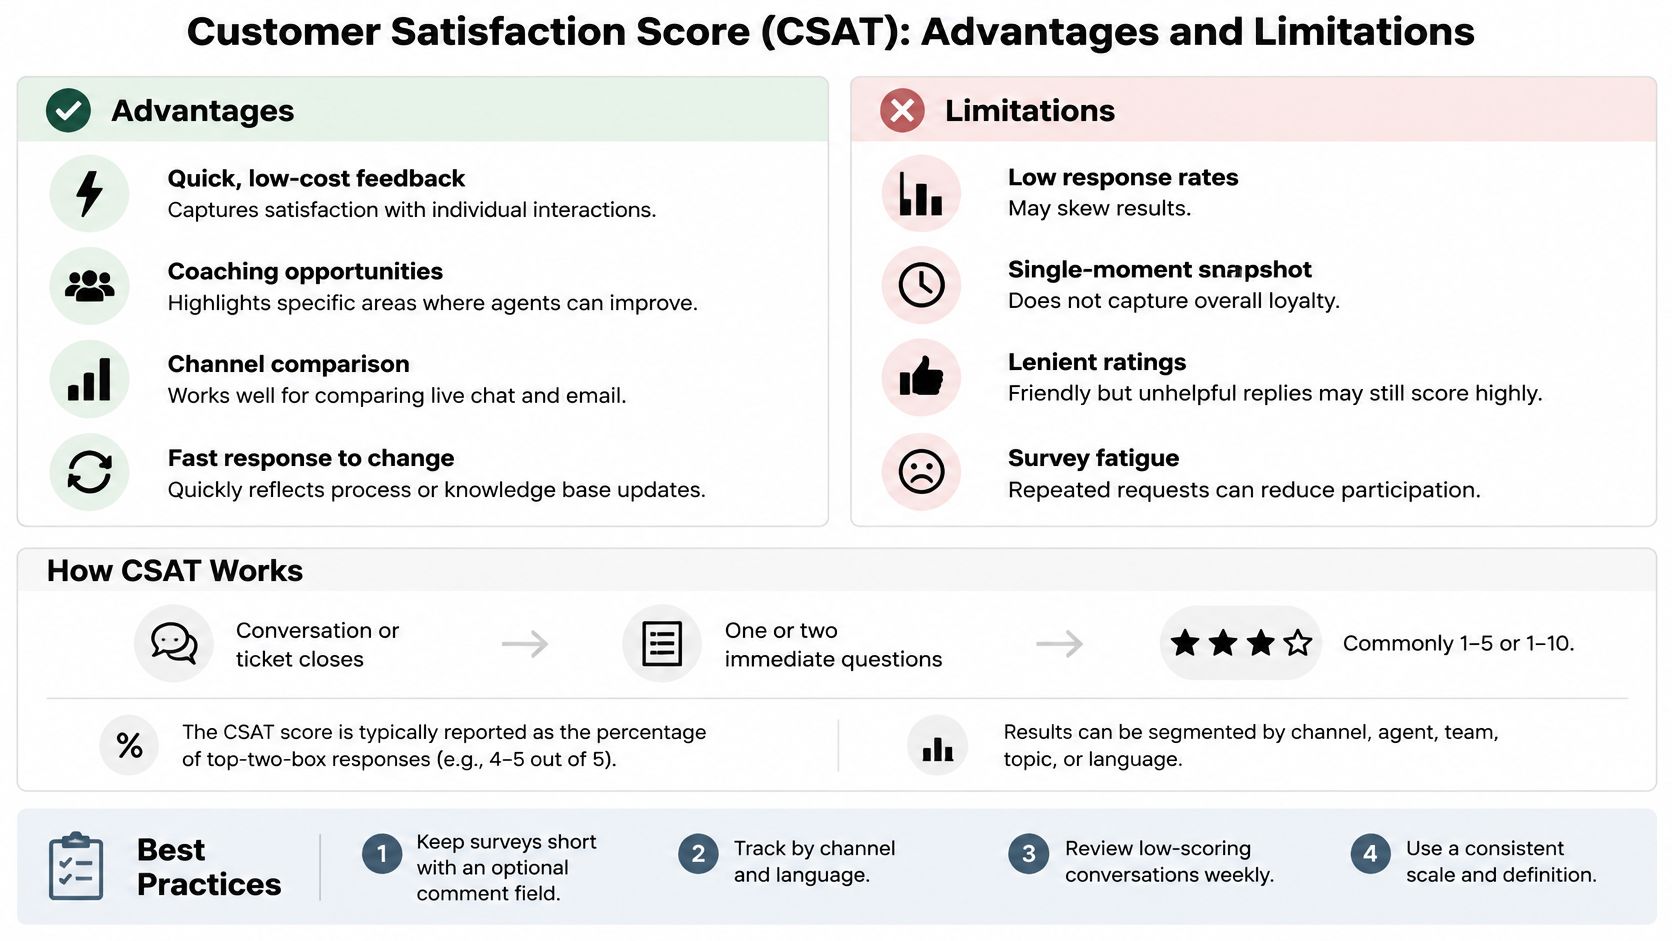
Where it lies
It scores the interaction, not the relationship, so a customer whose problem was fixed by a policy exception can still mark 3 because the policy existed at all. Responders also skew toward the delighted and the furious, which makes small samples noisy.
Set the target on a rolling window. Resolve247's benchmark compilation puts a healthy CSAT at roughly 80% to 90% measured over a rolling three months, which stops one bad Tuesday from triggering a rewrite of the entire help center.
Don't borrow a sector score as your target. The American Customer Satisfaction Index 2025 retail and consumer shipping study scored U.S. retail at 78.3 out of 100, up 0.4%, based on 41,850 completed surveys. That runs on a different scale, so treat it as evidence that satisfaction moves slowly, not as a number to copy.
Read the comments, not just the score. Say a billing question scores well below product questions for three straight weeks. That isn't a coaching problem, it's a pricing page problem, and the text field is where you find out. Writing CSAT survey questions that get answered decides whether you get ten responses or a hundred.
2. Net Promoter Score (NPS)
NPS asks one question: how likely are you to recommend us, on a 0 to 10 scale. Scores of 9 and 10 are promoters, 7 and 8 are passives, 0 to 6 are detractors, and the score is the promoter percentage minus the detractor percentage, from -100 to +100. It measures the relationship rather than the ticket, which is exactly why it gets misused on a support dashboard.
The follow-up question is the real metric
A bare number tells you an account is unhappy. The open-ended follow-up tells you why, and that's where the work happens. PwC's 2025 customer experience survey found 83% of executives saying their companies needed better tools to measure what drives purchases, while 84% said they had increased spending on customer loyalty. Spending more on loyalty without a usable read on its drivers is a strong argument for making the comment field mandatory.
Practical rule: never present NPS without the top three reasons detractors gave that month.
Three ways teams get NPS wrong
Reporting one company-wide number. A single score hides the client site or product line dragging it down. An agency running support for eight client sites tracks NPS per site and finds two accounts below zero while the blended average looks healthy, which is the wrong conclusion to reach in a monthly review.
Closing the loop late. Detractors should hear from a human within a set number of days, with the number written into the process. A follow-up six weeks later reads as an apology for caring late.
Surveying the same customer monthly. Repeat sends to the same account produce reflex scores and falling response rates. Cap the frequency per customer and rotate the sample.
3. Customer Effort Score (CES)
CES asks how easy it was to get the issue handled, typically on a 1 to 7 scale where 7 is effortless. The premise underneath it is that removing friction keeps customers more reliably than delighting them, which makes it the most underrated metric in the list. The CMSWire report on the measurement crisis in customer service found 47% of organizations use CSAT as a primary measure while only 28% use Customer Effort Score, so many teams are watching how customers felt and ignoring how hard they had to work.
What it catches that CSAT misses
Repeating an order number when a conversation moves from chat to email. A translated answer that loses the address format. A confirmation email that arrives without the tracking link the customer just asked for. None of these sink a CSAT score, and all of them make people leave.
"How easy was it to resolve your issue?" scores the path, not the outcome. A customer can be satisfied with the person and furious about the process.
Ask at the end of the task, not the end of the relationship. A CES question bolted onto an unrelated renewal survey measures nothing useful.
Search the comments for friction words. Terms like "repeat," "transfer," "again," and "confusing" cluster around the same broken steps week after week.
Use it to test consolidation. Compare CES before and after shared conversation history across chat and email. For the wider pattern, reducing effort in post-purchase support covers where friction accumulates after the sale.
4. First Response Time (FRT)
FRT measures the gap between a customer's first message and the first reply, whether a person or an automated system sends it. It's the most visible number in support because customers judge responsiveness before they can judge competence. Response time sits near the top of the priority list for practitioners too: HubSpot's survey of 1,400 customer service leaders found 29% of customer service professionals named it among the two most important customer-experience metrics to track in 2025.
Report percentiles instead of averages
Averages conceal the two cases customers complain about: the after-hours message and the complicated one. Track p50 and p90 time to first meaningful answer, and define "meaningful" in writing so a bot greeting that says nothing doesn't count as a response.

Keep AI and human replies in separate columns
Blending them produces a number that flatters automation and tells you nothing about staffing. A SaaS team splitting the columns typically finds chat answered instantly by AI, email answered the same business day by a person, and a genuine staffing gap in one language only.
Set targets by channel and priority. A live chat expected in seconds and an email expected within a business day are two different promises, so they need two different targets.
Watch the after-hours slice. That number is the business case for automated coverage outside staffed hours, and it's usually the most persuasive slide in a budget conversation.
Pair FRT with first contact resolution. A 15-second reply followed by three more messages isn't speed, it's a delay with better marketing. The pairing rules matter more than the target.
5. Average Resolution Time (ART)
ART measures the elapsed time from opening a conversation to marking it resolved, averaged across closed cases in the same period. It answers the question FRT doesn't: how long until the customer had a complete answer rather than a polite acknowledgement.
Where it earns its keep
Segment ART by issue type and handoff history and it turns into a diagnostic tool. Say a team notices billing disputes running far longer than product questions. The fix isn't coaching, it's an escalation path with refund authority attached, and ART is what surfaced the gap in the first place.
Decide whether the clock pauses. Time spent waiting on customer documents or approval is not the same as active work. Pick one rule, document it, and apply it to every channel.
Define "resolved" once. A ticket auto-closed for inactivity is not resolved, and a conversation closed by a bot's fallback isn't either. Without one shared definition, ART improves whenever the team gets sloppier.
Review the slowest tail monthly. Sort the slowest ten percent of cases and read them. Patterns show up fast: a missing integration, a policy that requires three approvals, a knowledge article no one has updated since the pricing change.
Where it lies
ART is an average, so one week-long ticket can distort a small team's whole month. Report the median and the 90th percentile next to it and the distortion disappears.
6. First Contact Resolution (FCR)
FCR is the percentage of issues resolved in the first interaction with no follow-up contact, transfer, or resubmission. It's the efficiency metric that behaves like a quality metric, because a repeat contact is both a cost and a frustration signal.
The definition does most of the work
FCR collapses unless the window is written down. A 72-hour window is standard: same customer, same issue, any channel, within three days counts as a repeat. Apply it across chat and email together, using one canonical case ID, or a customer who chats and then emails gets counted as two clean resolutions.
Combine system detection with agent tagging. Automated repeat matching catches the obvious cases; agent tagging catches the person who came back through a different name or a second address.
Mine repeat topics monthly. The top recurring topics convert directly into knowledge base articles, and the same articles feed both human agents and AI answers so nobody works from a different version of the truth.
Give AI and people one source. Conflicting answers generate reopens faster than anything else. A single published knowledge base used by customers, agents, and automation removes the most common cause.
Password resets are the classic example. Clear articles and a working self-service flow push FCR up on that topic within weeks, which frees agent time for the cases that need a human.
7. AI Containment Rate
AI containment measures the percentage of conversations fully handled by automation without a human agent. It's the headline efficiency number for AI support, and it's also the easiest metric in this list to game by accident.
Never read it alone
Standalone containment rewards silence. Verizon's 2025 customer experience research reports satisfaction at 88% for online interactions involving humans versus 60% for interactions driven by AI, while 60% of consumers still said they were largely satisfied with automated interactions over the preceding two years. Those two findings describe the same customer base: automation is acceptable and still not equal, which is why containment needs a satisfaction and reopen check attached.
Containment that isn't resolution
The failure mode looks like this. The AI answers a warranty question with policy language, the customer reads it, gives up, and emails from a different address two days later. Containment scored a win. Resolution scored a loss.
Practical rule: audit twenty contained conversations a week. If a contained conversation can't be described in one sentence as solved, it isn't contained.
Segment by topic. Shipping and returns contain well; refunds, warranty claims, and anything with an account exception should be routed deliberately rather than absorbed.
Count reopens within seven days. Any reopening after a contained session belongs in the containment denominator, not the resolved pile.
Feed gaps back weekly. Unresolved AI conversations are a content backlog, not a technology problem. The fix is usually a missing article, a stale policy page, or an answer the AI was never given.
8. AI-to-Human Escalation Rate
Escalation rate is the percentage of conversations handed from AI to a person, the counterpart to containment. Where containment shows what automation absorbed, escalation shows where it stopped, and together they describe the boundary of what your AI can handle.
Why the pairing matters now
The measurement gap is real. Adobe's Digital Trends report notes that 52% of organizations struggle to demonstrate measurable returns from AI using customer-experience metrics, only 44% have a generative-AI measurement framework, and just 31% have one for agentic AI. Escalation rate is the cheapest bridge across that gap, because it records a decision the system made rather than a sentiment it inferred.
Handoff quality has its own metrics
Summary completeness. The share of escalations carrying a usable summary of what was asked and tried. An agent who re-asks the first question has been handed a ticket, not context. Configuring a support chatbot that hands off cleanly is mostly a decision about what gets captured before the handoff.
Repeated questions after handoff. Count them. This number exposes bad summaries faster than any survey.
Time from escalation to human ownership. The clock keeps running for the customer, so a fast AI and a slow queue produce the same bad experience.
Resolution rate after handoff. The end of the story, and the only figure that proves the escalation was necessary rather than avoidable.
A rising escalation rate isn't automatically a failure. If the AI now recognizes that it doesn't know, and hands refund disputes to a specialist with full context, recorded escalations go up while trust and retention improve. Reason codes on every escalation are what separate the two cases.
9. Average Handle Time (AHT)
AHT measures the average active time an agent spends on an interaction, including conversation time and after-contact work like notes and ticket updates. It's a staffing and capacity metric, built for planning rather than for scoring individuals.
Use it for capacity, not for ranking agents
Shorter handle times look efficient right up until first contact resolution falls and the same customers come back, angrier and more expensive. The healthy way to read AHT is as the duration that keeps FCR and CSAT in range for your issue mix, not as a number to drive down.
Pair it with FCR and CSAT. Speed without resolution is a cost transfer, not a saving. When AHT drops and reopens rise, the team got faster at the wrong part of the job.
Segment by topic. A billing dispute and a shipping question have different natural lengths. A single blended AHT tells you only that your mix changed.
Avoid individual AHT targets. They teach agents to end conversations and to skip the escalation to a specialist who can actually fix the issue. Team-level capacity planning is where the metric belongs.
AI copilots shift this number without changing quality, since drafting a reply from conversation context saves typing time rather than thinking time. Watch FCR for a month before claiming the improvement is real.
10. SLA Compliance Rate
SLA compliance measures the percentage of conversations that met a defined response or resolution target. It's the accountability metric, the one that answers whether the operation delivered what it promised to customers or to internal stakeholders.
Define the clock before you promise it
State whether customer waiting pauses the timer. Most disputes about SLA numbers are really disputes about this rule. Write it down, publish it, and apply it identically for every priority tier.
Set targets per priority and channel. A single universal target either over-serves routine questions or under-serves outages. Urgent outage tickets and general product questions belong on separate clocks.
Use breach alerts, not post-mortems. A warning that fires before a deadline lets someone intervene. A weekly report on missed targets tells you only what already went wrong.
Report compliance next to satisfaction. A team hitting 99% compliance while satisfaction slides is meeting a deadline and missing the point.
For an agency running several client sites, compliance reported per site turns a vague promise into a monthly conversation with evidence behind it. That's the value of the metric: it makes service commitments visible to people outside the support team.
10 Customer Support KPIs and Metrics at a Glance
Use this table as a working reference: what each KPI measures, the job it does best, the way it misleads, and the companion metric that keeps it honest. The last two columns matter most, because every number on this list gets gamed once the team knows it is being watched.
| What It Measures | Best For | Main Pitfall | Pair It With |
|---|---|---|---|
| CSAT: satisfaction with a specific interaction | Fast, transaction-level feedback and agent coaching | Low response rates can skew results | CES and FCR |
| NPS: likelihood to recommend; promoters minus detractors | Tracking relationship-level loyalty over time | Influenced by factors beyond support | Open-ended follow-up and CSAT |
| CES: effort required to resolve an issue | Finding friction in support processes and self-service | Effort can be difficult to isolate or interpret | FCR and open-text feedback |
| FRT: time from customer message to first reply | Monitoring responsiveness and queue bottlenecks | A quick reply may not be helpful | CSAT and resolution time |
| ART: time from ticket creation to resolution | Identifying slow issue types and process bottlenecks | Customer delays and outliers can skew averages | Backlog and aging reports |
| FCR: percentage of issues resolved in the first interaction | Reducing repeat contacts and identifying knowledge gaps | Poor definitions can distort results or encourage premature closure | CSAT and repeat-contact tracking |
| AI Containment Rate: share of AI conversations resolved without human help | Assessing AI self-service coverage and workload reduction | High containment can mask unresolved or frustrating interactions | CSAT and escalation rate |
| AI-to-Human Escalation Rate: share of AI conversations handed to a human | Identifying automation limits and human staffing needs | High rates may be appropriate for complex or sensitive topics | Time to human response and resolution time |
| AHT: average active handling and wrap-up time | Workforce planning and workflow efficiency | Shorter handling time can come at the expense of quality | FCR and CSAT |
| SLA Compliance Rate: share of cases meeting response or resolution targets | Tracking service commitments and breach risk | Poorly defined targets or clocks can mislead | CSAT and breach alerts |
Read the pitfall column before you set any target. It shows how each metric inflates once it becomes a goal, and the pairing column names the second number that exposes that inflation. On Monday, pick the three or four rows that match your current bottleneck rather than reporting all ten.
Building a Balanced Scorecard and Deciding Which Metrics to Pair
No single KPI tells the truth on its own. Speed metrics need a quality metric beside them or they get gamed within a quarter, so pair first response time with CSAT and average handle time with first contact resolution. A fast reply that solved nothing shows up later as a reopen. Automation needs identical treatment: read containment alongside escalation rate and satisfaction on AI-handled conversations, because a customer who gave up on the bot counts the same as a resolved one unless you check.
The framework behind this habit is decades old. Kaplan and Norton's 1992 Harvard Business Review article introduced the Balanced Scorecard after a year-long research project with 12 companies developing new performance measurement approaches, arguing that financial indicators alone gave misleading signals about innovation and continuous improvement. Their four perspectives, financial, customer, internal process, and learning and growth, map onto a support operation as cost per contact, CSAT, resolution time, and knowledge coverage. A 2001 CFO.com report cited estimates that about 50% of Fortune 1,000 companies in North America were already using it, with adoption in Europe at 40% to 45%.
A small team doesn't need the full framework. It needs leading indicators next to lagging ones, and a short list everyone can recite. Three steps make that real.
Pick three to five metrics and stop. For a team of three, that's usually FCR, CSAT, p90 first response time, and containment. Add escalation rate the moment AI handles a meaningful share of conversations. Then decide which targets can backfire before you set them: a hard ceiling on response time produces fast, empty replies, and a hard floor on containment keeps conversations inside the AI that should have gone to a human.
Define each one in writing. The window, the channel scope, the scale, and who gets excluded. Spell out what counts as resolved for both AI and human conversations, because a containment number built on a looser definition than your FCR number compares nothing. Definitions that live only in someone's head produce meetings about definitions.
Review on a fixed weekly clock. Same thirty minutes, same owner, same three questions: what moved, why, and what changes this week. A monthly review is too slow to catch a knowledge gap; a daily one is too noisy to act on.
SignalZen routes chat and email into one workspace, so both channels feed the same queues and reporting. Its AI answers from a help center you publish, the same articles customers read, and on handoff agents receive the full conversation history, so nobody asks the customer to repeat themselves. The collected data is available in the Console at console.signalzen.com after logging in. See how the widget, AI answers, and human handoff fit together at SignalZen.

Better support without a bigger support team.
Start with AI. Add your team when the conversation needs a person.